

Superintendent's Goal 3
Superintendent's Goal 3: Safety and Well-Being
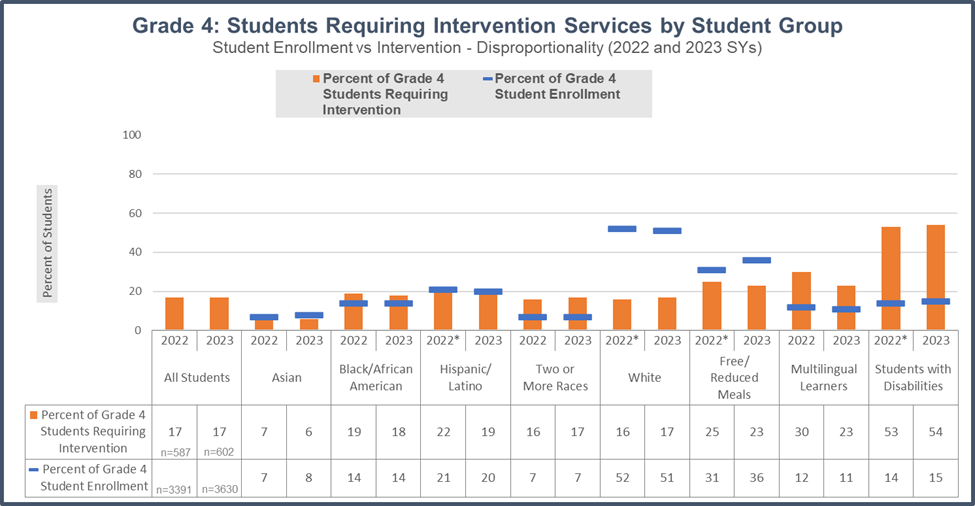
- Effective intervention strategies for all students
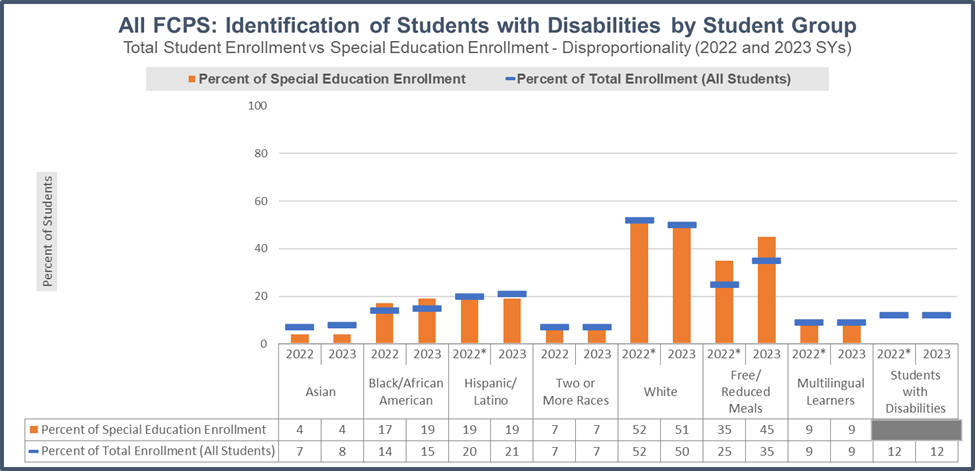
- Referral rates to special education
- Continuum of services for students
- Compliance
Key Performance Indicators
Years in Intervention Services
|
Level |
Content |
Number of Students in Interventions |
|||||
|
2022 (Baseline) |
2023 |
||||||
|
Total in Intervention* |
2-3 Years** |
≥ 4 Years** |
Total in Intervention* |
2-3 Years** |
≥ 4 Years** |
||
|
All Grades |
Reading |
6,122 |
37% |
24% |
5,941 |
48% |
21% |
|
Math |
2,498 |
46% |
11% |
2,352 |
43% |
8% |
|
|
Elementary |
Reading |
3,486 |
32% |
15% |
3,306 |
44% |
14% |
|
Math |
780 |
30% |
5% |
840 |
26% |
4% |
|
|
Secondary |
Reading |
2,636 |
45% |
35% |
2,635 |
52% |
31% |
|
Math |
1,718 |
53% |
13% |
1,512 |
53% |
11% |
|
|
* Total number of students receiving interventions in school year regardless of year in intervention. |
|||||||