![]()
![]()
![]()
![]()
![]()
![]()
![]()
![]()
Key Performance Indicators, School Year 2023-24
Superintendent's Goal 1: Organizational Culture of Achievement
- Structures and routines to build staff capacity
- High quality teaching
- Successful outcomes for learners
| Student Group* | Percent of Students On-Track** | |
| 2022(n=3,588) | 2023 (n=3,382) | |
| All Students | 90 | 89 |
| Asian | 95 | 96 |
| Black/African American | 86 | 86 |
| Hispanic/Latino | 85 | 80 |
| Two or More Races | 92 | 89 |
| White | 92 | 93 |
| Free/Reduced Meals | 80 | 78 |
| Multilingual Learner | 71 | 62 |
| Students with Disabilities | 77 | 73 |
| * Student groups with less than 10 students are not shown. ** Percent based on total number of students within the student group. |
||
| Student Group* | Percent of Students Meeting CCR Requirements by End of Grade 10 | ||||||||
| Current CCR Standard* | MSDE Proposed CCR Standard** |
||||||||
| ELA | Math | Both | Both | ||||||
| 2022 | 2023 | 2022 | 2023 | 2022 | 2023 | 2023 | |||
| All Students* | 71 | 74 | 5 | 27 | 5 | 26 | 66 | ||
| Asian | 90 | 92 | 17 | 56 | 17 | 55 | 86 | ||
| Black/African American | 57 | 69 | *** | 16 | *** | 15 | 55 | ||
| Hispanic/Latino | 48 | 55 | *** | 13 | *** | 13 | 52 | ||
| Two or More Races | 70 | 77 | 6 | 32 | 5 | 31 | 65 | ||
| White | 80 | 81 | 5 | 32 | 5 | 32 | 73 | ||
| Free/Reduced Meals | 46 | 55 | 13 | 13 | 12 | 13 | 47 | ||
| Multilingual Learner | 6 | 11 | *** | *** | *** | *** | 32 | ||
| Students with Disabilities | 25 | 28 | *** | 6 | *** | 6 | 36 | ||
| *Current CCR Standard: MCAP ENGLISH 10/MCAP ALG I/II or GEO/MATH SAT **MSDE Proposed CCR Standard: MCAP ENGLISH 10, MCAP ALGEBRA I, MATH SAT/GPA 3.0 Note: Students may count for both race/ethnicity and special services in multiple student groups. *** Data suppression rules applied, n<10, or <5% or>95%. |
|||||||||
|
Student Group |
Number of Students Enrolled in Full-Day Pre-K by Tier** |
|||||||
|
Tier 1 |
Tier 2 |
Tier 3 |
Total |
|||||
|
2023 |
2024** |
2023 |
2024** |
2023 |
2024** |
2023 |
2024** |
|
|
All Students* |
749 |
909 |
144 |
227 |
74 |
136 |
967 |
1272 |
|
Asian |
29 |
56 |
13 |
29 |
11 |
12 |
53 |
97 |
|
Black/African American |
175 |
186 |
22 |
32 |
17 |
31 |
214 |
249 |
|
Hispanic/Latino |
278 |
332 |
14 |
31 |
10 |
30 |
302 |
393 |
|
Two or More Races |
70 |
67 |
10 |
19 |
* |
* |
87 |
94 |
|
White |
194 |
261 |
84 |
113 |
29 |
55 |
307 |
429 |
|
Free/Reduced Meals |
562 |
639 |
17 |
39 |
23 |
45 |
602 |
723 |
|
Multilingual Learner |
*** |
268 |
*** |
37 |
*** |
23 |
*** |
328 |
|
Students with Disabilities |
45 |
63 |
20 |
48 |
24 |
95 |
89 |
206 |
|
* Student groups with less than 10 are not shown. |
||||||||
ELA Grades 3-8
| Student Group* | MCAP ELA Cohort Grades 3-8: Percent of Students Proficient or Distinguished |
||||||
| 2022 Cohort Grade 3* | 2022 Cohort Grade 4** | 2022 Cohort Grade 5*** | 2023 Cohort Grade 3^ | ||||
| 2022 (n=3,131) |
2023 (n=3,055) |
2022 (n=3,126) |
2023 (n=3,060) |
2022 (n=3,278) |
2023 (n=3,185) |
2023 (n=3,368) |
|
| All Students | 55 | 59 | 57 | 53 | 52 | 59 | 60 |
| Asian | 77 | 79 | 74 | 72 | 82 | 86 | 82 |
| Black/African American | 45 | 49 | 50 | 43 | 40 | 48 | 52 |
| Hispanic/Latino | 39 | 43 | 41 | 38 | 37 | 41 | 42 |
| Two or More Races | 49 | 62 | 59 | 52 | 51 | 62 | 58 |
| White | 61 | 64 | 62 | 59 | 57 | 65 | 66 |
| Free/Reduced Meals | 32 | 39 | 37 | 33 | 31 | 39 | 40 |
| Multilingual Learner | 24 | 22 | 22 | 7 | 10 | 4 | 19 |
| Students with Disabilities | 16 | 14 | 18 | 13 | 13 | 14 | 23 |
| Data excludes students who were retained in any grade. * Includes only the same students enrolled in Grade 3 in 2022 and Grade 4 in 2023. ** Includes only the same students enrolled in Grade 4 in 2022 and Grade 5 in 2023. *** Includes only the same students enrolled in Grade 5 in 2022 and Grade 6 in 2023. ^ Includes students enrolled in Grade 3 in 2023. |
|||||||
| Student Group* | MCAP ELA Cohort Grades 3-8: Percent of Students Proficient or Distinguished |
||||
| 2022 Cohort Grade 6* | 2022 Cohort Grade 7** | 2022 Cohort Grade 8*** | |||
| 2022 (n=3,258 |
2023 (n=3,194) |
2022 (n=3,309) |
2023 (n=3,256) |
2022 (n=3,360) |
|
| All Students | 54 | 58 | 52 | 57 | 49 |
| Asian | 75 | 79 | 80 | 80 | 79 |
| Black/African American | 42 | 48 | 39 | 44 | 36 |
| Hispanic/Latino | 34 | 39 | 35 | 37 | 30 |
| Two or More Races | 55 | 58 | 46 | 55 | 49 |
| White | 61 | 65 | 59 | 65 | 56 |
| Free/Reduced Meals | 29 | 36 | 25 | 31 | 26 |
| Multilingual Learner | 3 | 4 | 2 | 4 | 3 |
| Students with Disabilities | 10 | 13 | 11 | 16 | 9 |
| Data excludes students who were retained in any grade. * Includes only the same students enrolled in Grade 6 in 2022 and Grade 7 in 2023. ** Includes only the same students enrolled in Grade 7 in 2022 and Grade 8 in 2023. *** Includes students enrolled in Grade 8 in 2022. |
|||||
MCAP Math Grades 3-8
| Student Group* | MCAP Math Grades 3-8: Percent of Students Proficient or Distinguished |
||||||
| 2022 Cohort Grade 3 | 2022 Cohort Grade 4 | 2022 Cohort Grade 5 | 2023 Cohort Grade 3 | ||||
| 2022 (n=3,149) |
2023 (n=3,054) |
2022 (n=3,152) |
2023 (n=3,060) |
2022 (n=3,294) |
2023 (n=3,186) |
2023 (n=3,391) |
|
| All Students | 50 | 45 | 37 | 38 | 35 | 26 | 55 |
| Asian | 77 | 72 | 60 | 64 | 64 | 58 | 77 |
| Black/African American | 34 | 29 | 26 | 24 | 22 | 17 | 44 |
| Hispanic/Latino | 32 | 27 | 21 | 22 | 20 | 12 | 38 |
| Two or More Races | 47 | 46 | 37 | 39 | 28 | 20 | 50 |
| White | 56 | 52 | 44 | 45 | 41 | 30 | 61 |
| Free/Reduced Meals | 26 | 24 | 18 | 18 | 14 | 9 | 33 |
| Multilingual Learner | 16 | 11 | 12 | 6 | 4 | ≤1 | 20 |
| Students with Disabilities | 16 | 13 | 12 | 9 | 9 | 6 | 24 |
| Data excludes students who were retained in any grade. * Includes only the same students enrolled in Grade 3 in 2022 and Grade 4 in 2023. ** Includes only the same students enrolled in Grade 4 in 2022 and Grade 5 in 2023. *** Includes only the same students enrolled in Grade 5 in 2022 and Grade 6 in 2023. ^ Includes students enrolled in Grade 3 in 2023. |
|||||||
| Student Group* | MCAP Math Cohort Grades 6-8: Percent of Students Proficient or Distinguished |
||||||
| 2022 Cohort Grade 6* | 2022 Cohort Grade 7** | 2022 Cohort Grade 8*** | |||||
| 2022 (n=3,243) |
2023 (n=3,196) |
2022 (n=3,312) |
2023 (n=3,329) |
2022 (n=3,523) | |||
| All Students | 23 | 29 | 26 | 33 | 28 | ||
| Asian | 52 | 61 | 59 | 76 | 59 | ||
| Black/African American | 13 | 18 | 16 | 21 | 14 | ||
| Hispanic/Latino | 9 | 11 | 13 | 16 | 15 | ||
| Two or More Races | 18 | 24 | 21 | 24 | 24 | ||
| White | 26 | 35 | 30 | 39 | 33 | ||
| Free/Reduced Meals | 7 | 11 | 7 | 11 | 9 | ||
| Multilingual Learner | ≤1 | ≤1 | 2 | 2 | ≤1 | ||
| Students with Disabilities | 4 | 5 | 5 | 8 | 5 | ||
| Data excludes students who were retained in any grade. For math, students are combined by grade level regardless of the math assessment they took (e.g., Math Grade 7, Math Grade 8, Algebra I or II, or Geometry). * Includes only the same students enrolled in Grade 6 in 2022 and Grade 7 in 2023. ** Includes only the same students enrolled in Grade 7 in 2022 and Grade 8 in 2023. *** Includes students enrolled in Grade 8 in 2022. |
|||||||
|
Student Group * |
Percent of Students Not Chronically Absent |
|||||||||
|
All |
Elementary |
Middle |
High |
|||||||
|
2022** |
2023 |
2022** |
2023 |
2022** |
2023 |
2022** |
2023 |
|||
|
All Students** |
74.0 |
79.3 |
74.8 |
80.9 |
74.9 |
80.0 |
72.2 |
76.6 |
||
|
Asian |
84.6 |
87.1 |
82.4 |
85.7 |
87.6 |
90.7 |
85.8 |
86.5 |
||
|
Black/African American |
75.5 |
80.8 |
77.4 |
83.3 |
75.9 |
82.4 |
72.6 |
76.4 |
||
|
Hispanic/Latino |
65.5 |
72.6 |
65.5 |
73.3 |
69.6 |
77.7 |
62.6 |
68.1 |
||
|
Two or More Races |
68.9 |
75.3 |
69.6 |
77.2 |
69.0 |
73.8 |
67.2 |
72.8 |
||
|
White |
76.6 |
81.1 |
78.4 |
83.3 |
75.5 |
79.5 |
75.0 |
79.6 |
||
|
Free/Reduced Meals |
60.1 |
69.2 |
62.4 |
72.1 |
61.1 |
71.1 |
55.5 |
63.5 |
||
|
Multilingual Learner |
64.9 |
72.5 |
67.7 |
75.5 |
71.2 |
76.9 |
53.8 |
62.7 |
||
|
Students with Disabilities |
63.9 |
69.7 |
67.2 |
72.8 |
62.9 |
68.0 |
59.8 |
66.2 |
||
|
* Student groups with less than 10 students are not shown. |
||||||||||
|
Student Group* |
Out-Of-School Suspension Rates |
|||||||||
|
All |
Elementary |
Middle |
High |
|||||||
|
2022** |
2023 |
2022** |
2023 |
2022** |
2023 |
2022** |
2023 |
|||
|
All Students* |
3.0 |
3.3 |
≤1 |
≤1 |
5.6 |
6.0 |
4.7 |
4.7 |
||
|
Asian |
≤1 |
≤1 |
≤1 |
≤1 |
1.4 |
1.8 |
1.1 |
1.1 |
||
|
Black/African American |
6.3 |
6.8 |
≤1 |
1.6 |
11.2 |
12.4 |
9.4 |
9.3 |
||
|
Hispanic/Latino |
3.3 |
3.2 |
≤1 |
≤1 |
6.2 |
6.6 |
5.4 |
4.7 |
||
|
Two or More Races |
3.6 |
4.6 |
≤1 |
1.6 |
7.6 |
8.6 |
5.9 |
7.1 |
||
|
White |
2.2 |
2.4 |
≤1 |
≤1 |
4.0 |
4.1 |
3.3 |
3.5 |
||
|
Free/Reduced Meals |
5.2 |
6.3 |
≤1 |
1.6 |
10.5 |
11.8 |
8.0 |
9.1 |
||
|
Multilingual Learner |
3.7 |
3.6 |
≤1 |
≤1 |
9.3 |
9.4 |
7.9 |
5.9 |
||
|
Students with Disabilities |
7.7 |
7.3 |
2.1 |
2.6 |
12.5 |
11.9 |
11.9 |
10.5 |
||
|
* Student groups with less than 10 students are not shown. Students may count for both race/ethnicity and special services in multiple student groups. |
||||||||||
Superintendent's Goal 2: Operational Excellence
- Organizational systems and structures to address system and school needs
Data coming soon.
Superintendent's Goal 3: Safety and Well-Being
- Effective intervention strategies for all students
- Referral rates to special education
- Continuum of services for students
- Compliance
Years in Intervention Services
|
Level |
Content |
Number of Students in Interventions |
|||||
|
2022 (Baseline) |
2023 |
||||||
|
Total in Intervention* |
2-3 Years** |
≥ 4 Years** |
Total in Intervention* |
2-3 Years** |
≥ 4 Years** |
||
|
All Grades |
Reading |
6,122 |
37% |
24% |
5,941 |
48% |
21% |
|
Math |
2,498 |
46% |
11% |
2,352 |
43% |
8% |
|
|
Elementary |
Reading |
3,486 |
32% |
15% |
3,306 |
44% |
14% |
|
Math |
780 |
30% |
5% |
840 |
26% |
4% |
|
|
Secondary |
Reading |
2,636 |
45% |
35% |
2,635 |
52% |
31% |
|
Math |
1,718 |
53% |
13% |
1,512 |
53% |
11% |
|
|
* Total number of students receiving interventions in school year regardless of year in intervention. |
|||||||
Superintendent's Goal 4: Stakeholder Engagement
- Timely, transparent, and concrete engagement
- Innovative and access opportunities
Data coming soon.
Superintendent's Goal 5: Student & Staff Experience
- Procedures and practices to ensure safety and well-being of both students and staff
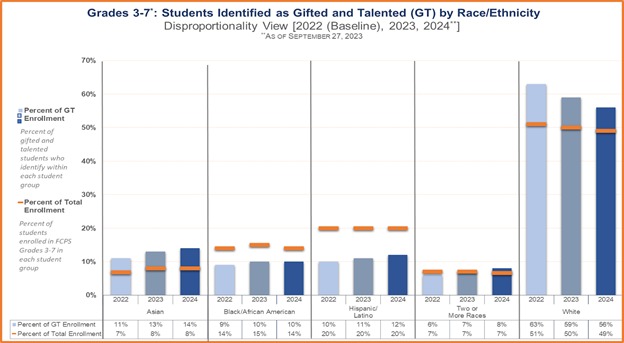
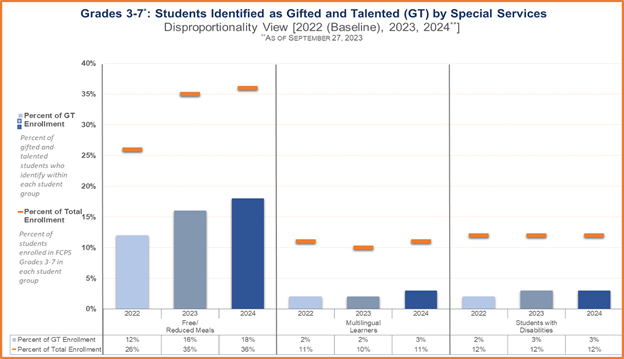
Grades 3-7 by Race/Ethnicity and Special Services
*Students were universally screened when in second grade.
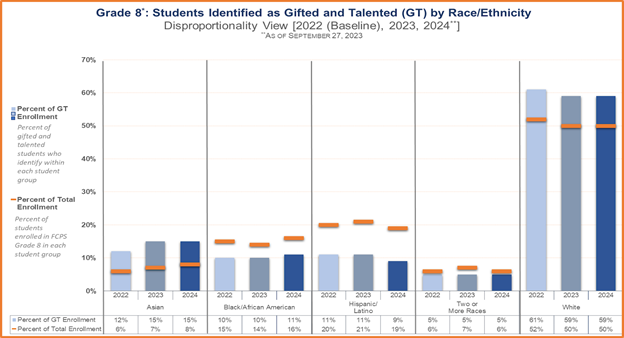
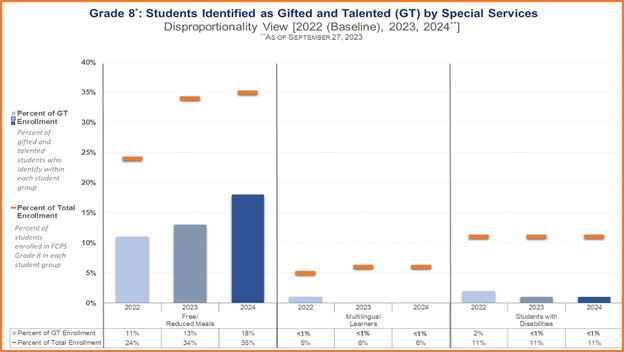
Grade 8 by Race/Ethnicity and Special Services
*Includes students participating in Highly Able Learner (HAL) programs, which also includes students in Young Scholars Program, former Magnet, and Math Pathway
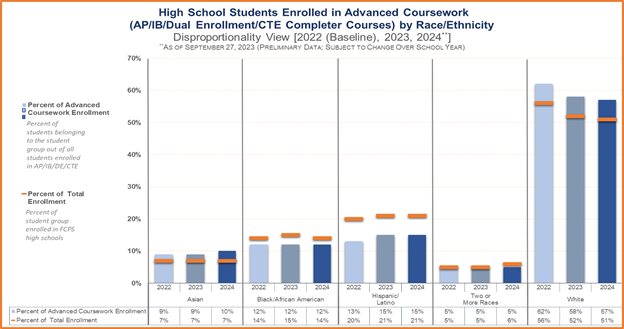
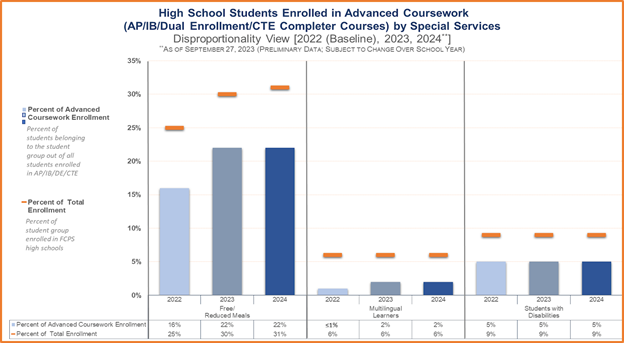
Grades 9-12: Students Enrolled in At Least One Advanced Coursework by Race/Ethnicity and Special Services
Data coming soon.
This site provides information using PDF, visit this link to download the Adobe Acrobat Reader DC software.